There are two technical terms for when the 50 day moving average (50DMA) and 200 DMA cross paths. When the 50 day indicator is rising, and crosses over the 200 DMA it is known as a Golden Cross, and is considered a very bullish indicator. But when the 50 DMA has a downward path, and crosses below the 200 DMA it is known as a Death Cross and represents a bearish indicator for any given market, industry, stock, or asset.
With the Dow falling more than 200 points on the NYSE on Aug. 11, the indicie has now experienced a Death Cross, and one that has not been fully seen since 2011 when the stock market recovery began thanks to the Federal Reserve’s Quantitative Easing.
The Dow Jones Industrial Average’s biggest decline in a month is proving the final nail in its death cross.
That’s what technical analysts call it when the 50-day moving average falls below the 200-day mean, a formation that was achieved today as the gauge declined for the eighth time in nine days. The pattern is commonly interpreted as a signal price momentum is fizzling out.
“If you don’t make any upside progress, the moving average will start to flatten and eventually turn down,” Jonathan Krinsky, chief market technician at MKM Holdings LLC, said by phone. “There are fewer and fewer stocks holding up the market, and that’s generally not a good thing.” - Bloomberg
Graph courtesy of Bloomberg
As you can see from the five year chart, the 50DMA did touch the 200DMA a number of times since 2011, but never fully broke support to validate a downward trend. Yet the Dow is just one of many indicators that signify the strength or weakness of an economy, and let’s take a look at two other indicators from the last time there was a Dow Death Cross.
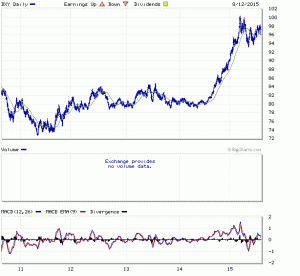
The last time the Dow was on the wrong side of a Death Cross in 2011, the dollar was experiencing a massive decline in value, and was hemorrhaging in the low 70’s.
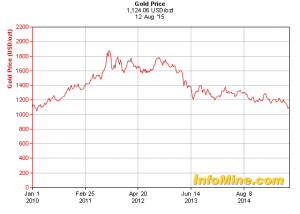
And with the dollar at its lowest levels in decades back in 2011, the natural winner in all of this was of course gold.
Since the Dow crossed over the 200DMA yesterday, the markets appear to be continuing the downward trend today as the indicie is down over 240 points on growing fear from the Chinese devaluation, and a sudden revelation on economic indicators that have been masked by government rhetoric for several years. And now that all equity markets are in the red for the year, and we are entering into an extremely volatile time for the markets, for gold, and inevitably the dollar, this Death Cross indication could very well mean that the markets are ready to move strongly into a Bear Market.
Kenneth Schortgen Jr is a writer for Secretsofthefed.com, Examiner.com, Roguemoney.net, and To the Death Media, and hosts the popular web blog, The Daily Economist. Ken can also be heard Wednesday afternoons giving an weekly economic report on the Angel Clark radio show.
Don't miss these
- Non Gamstop Casinos UK
- Best Casino Not On Gamstop
- Siti Sicuri Non Aams
- Casinos Not On Gamstop
- Casino Not On Gamstop
- Casino Online Stranieri Non Aams
- Non Gamstop Casino
- Sites Not On Gamstop
- Non Gamstop Casino UK
- Slots Not On Gamstop
- Casino En Ligne
- Casino En Ligne
- Casino En Ligne France
- 信用 できるオンラインカジノ
- UK Casino Not On Gamstop
- Casinos Not On Gamstop
- Casino Online Non Aams
- I Migliori Casino Non Aams
- Siti Casino Online Non Aams
- Non Gamstop Casino Sites UK
- Casino En Ligne Fiable
- Best Non Gamstop Casinos
- Non Gamstop Casino
- Betting Sites UK
- Casino Non Aams
- Crypto Casino
- Meilleur Casino En Ligne Français
- Casinos Belgique
- Casino Online
- Paris Sportif Ufc
- オンラインカジノ 出金早い
- KYC 없는 카지노
- казино онлайн
- Migliori Siti Scommesse
- Casino Online
- Casino En Ligne Fiable
- Casino En Ligne 2026
- Nouveau Casino En Ligne France
- Casino En Ligne


